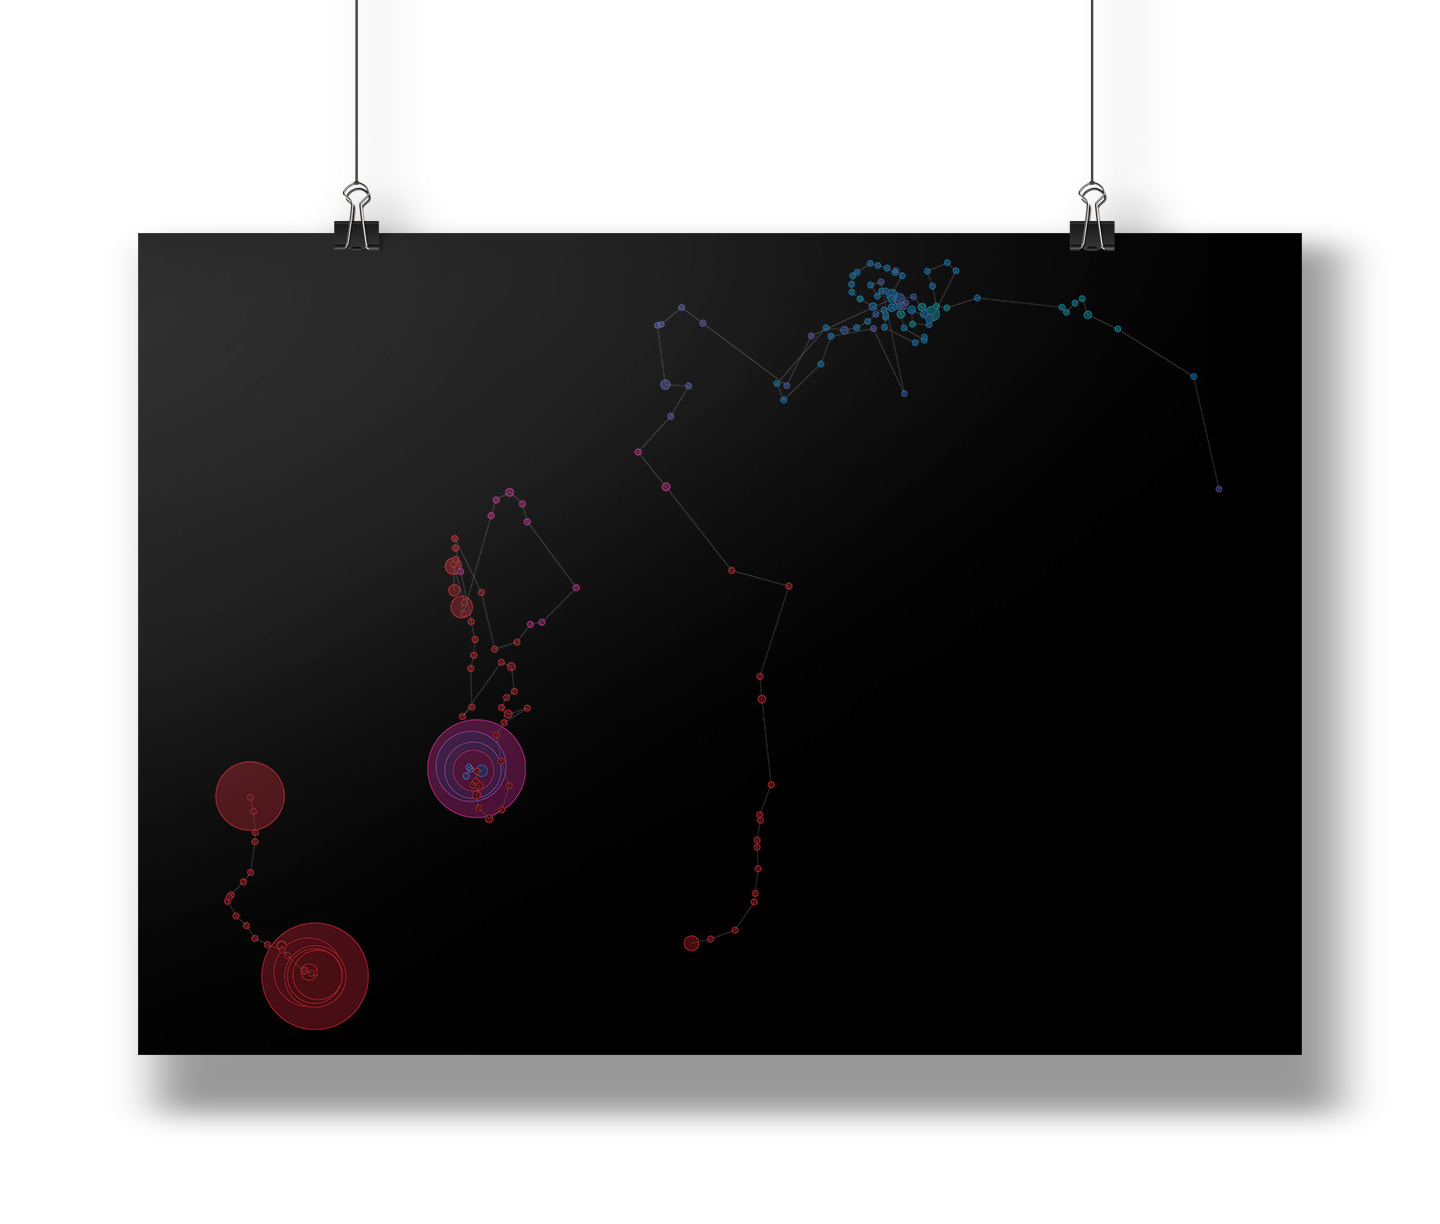
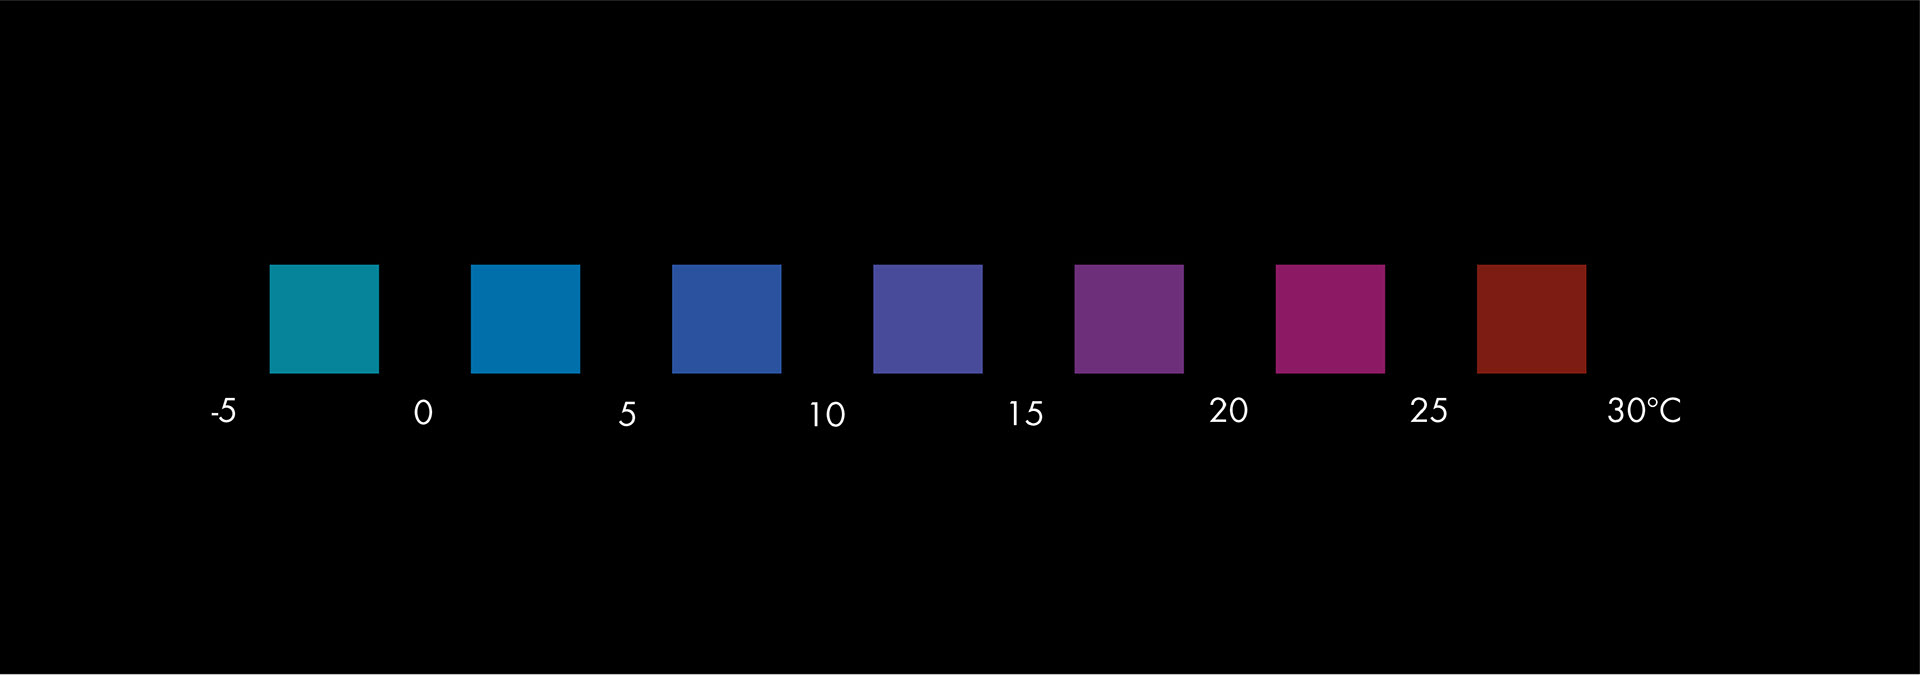
The project compares and visualizes data for the route of three different sea turtle types. It covers the distance as well as the outdoor temperature over the period of 218 days. The visualization is based on the geographical location of tracked sea turtles. In addition to the analogue poster a digital application will be created.
Sea turtle conservancy
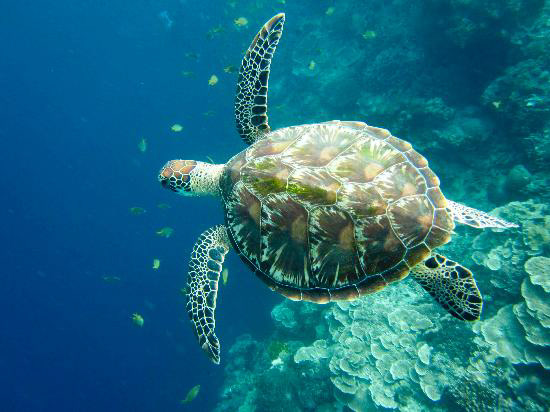
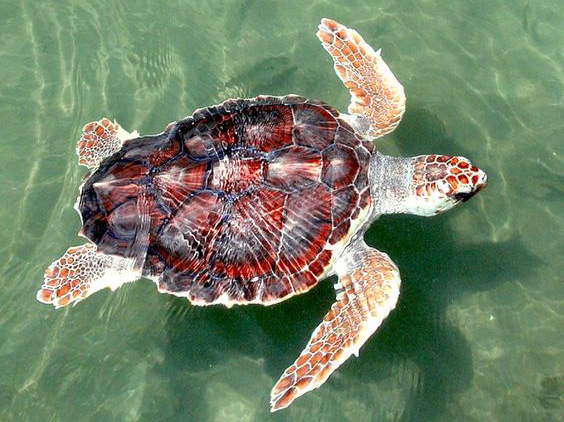
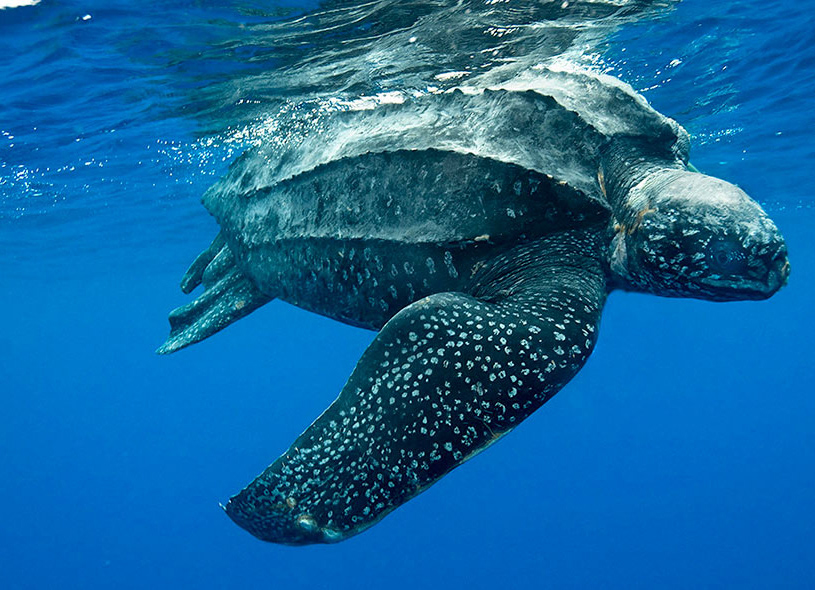
Auf der Website konnten wir die Meeresschildkröten und ihre Routen verfolgen. Beobachtet werden drei Arten: Greenturtle, Loggerhead und Leatherback. Nicht nur Daten und Koordinaten, sondern auch genaue Trackingmaps sind auf der Internetseite einzusehen. Wir schauten uns jede Schildkröte der Seite an und entschieden uns für drei Schildkröten, welche in einem ähnlichen Zeitraum getrackt werden und visuell interessant sind.
Via the website we were able to follow the sea turtles and their routes. Three types were observed: Greenturtle, Loggerhead and Leatherback. Not only did we find accurate coordinates on the website, but also precise tracking maps. We looked at every turtle we have tracked, before we decided on three turtles, which were tracked in a similar period and show visually interesting routes.
Digitale Anwendung
Ergänzend Zum Plakat erstellten wir eine interaktive Visualisierung. Man bekommt detailiertere Informationen über die drei Schildkrötenarten und über bestimmte Trackingpunkte. Über einen Slider können spezifisch Temperaturen ausgewählt werden.
Digital application
In addition to the poster we created an interactive visualization. As a result it shows more detailed information about the three turtles and their specific tracking points. Temperatures can be selected with a slider.


